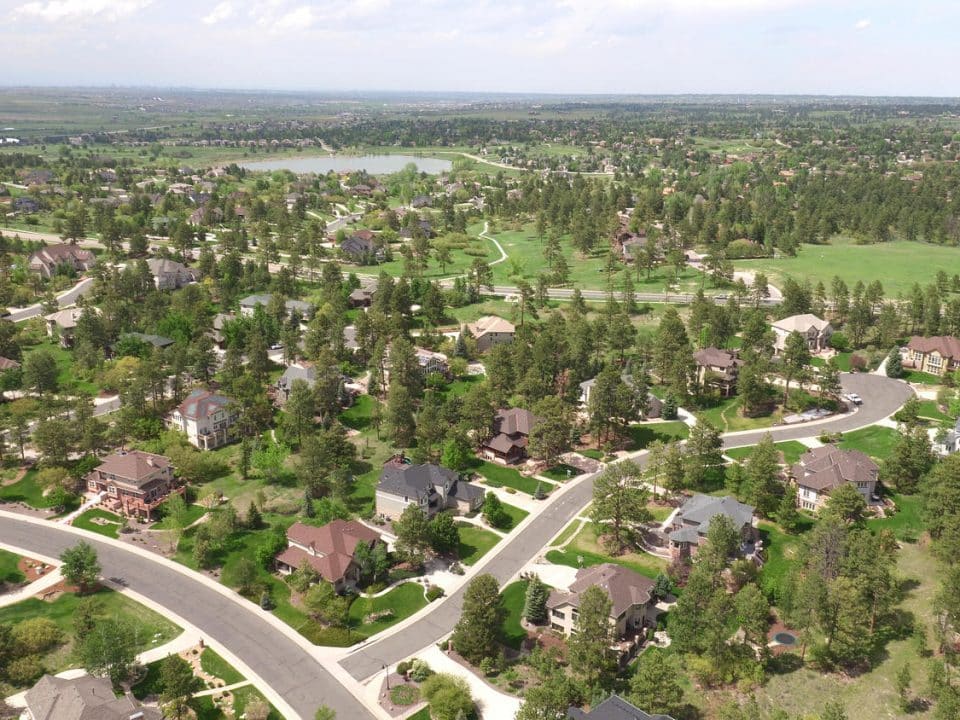
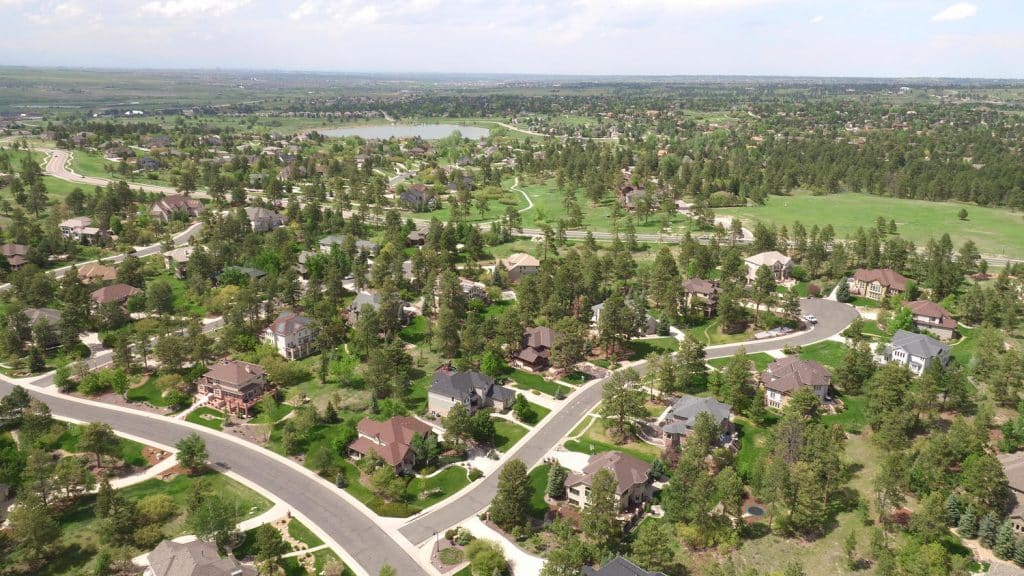
Featured Homes

Helpful Parker CO Links

Short Sales Info

Neighborhoods

Local Resources

Videos

Categories

Archives

Homes Sales in The Pinery. Parker Colorado

Mar 15th 11

filed under: Real Estate Stats, The Timbers

The Pinery Home Sales Report

The Pinery Home Sales Report


In this report you will see all the home sales in the Pinery Neighborhood from 2007 to the end of 2010. All price ranges. The report shows only home sales EAST of Parker road and does not include home sales in the newer Pinery Glenn neighborhood.

After writing an article detailing home sale trends over the past 4 years in Stonegate, and Pradera Golf Club other Parker, Colorado communities, I decided to produce the same stats for The Timbers & The Pinery.

Video Helps Sell Your Home

The Pinery is consistently one of the top selling neighborhoods in Parker, Colorado. We have to believe that the location, beautiful rolling hills, wildlife and of course the pine forests that blanket the entire neighborhood are the reasons. There are homes available for every buyer in every price range in The Pinery and that makes it very appealing.

My report below for all the home sales in The Pinery is only covering single family homes. Not the condos and town homes or any other attached homes in The Pinery.

FYI-Lenders are calling me all the time to make sure I understand that money is now available for high-end luxury home buyers where it was unavailable just 18 to 24 months ago.

What do you get when you list your home for sale with Steven Beam? See it here.

Total Sales by Year: (These are home sales for The Pinery on the EAST side of Parker Road.)

2007 = 81

2008 = 133

2009 = 99

2010 = 127

Average Total Days on Market: (Less time on the market for 2010 may reflect less inventory and lower prices.)

2007 = 130

2008 =133

2009 = 153

2010 =135

Average NET Sold Price: (There were some really big sales in 2009. Some approaching $2 million.)

2007 = $628,659

2008 = $456,531

2009 = $500,337

2010 = $482,574

Total Volume of NET Sales By Year in The Timbers:

2007 = $50,921,391

2008 = $61,915,660

2009 = $49,533,393

2010 = $61,286,870

Average NET $ or Price per sqft Sold: (This is the sqft on the main level and upper level. It does not include the basement.)
2007 = $196

2008 = $166

2009 = $169

2010 = $164

The average price per sqft has dropped considerably and seems to have leveled off.

Average Price per sqft Finished. (All finished sqft included.)

2007 = $155

2008 = $127

2009 = $128

2010 = $120

The Timbers Luxury Homes Sales Trends

Pradera Golf Club 4 Years Of Home Sales Trends

Stonegate Neighborhood home sales for the past 4 years.

What do all the numbers mean on a real estate closing sheet?

Home for Sale in Stonegate

Be a Voyeur in Your Neighborhood

Contact-Us Search-Homes What-is-my-Home-Worth

Tags: , , , ,

posted by Steven Beam // Please leave a comment.

Pradera Golf Club 4 Years of Home Sale Trends

Jan 27th 11

filed under: Pradera, Real Estate Answers, Real Estate Stats, The Timbers

Pradera Golf Club Custom Home

Pradera Golf Club Custom Home

Notice the reflection of the clouds in this custom home perched high on the hill in Pradera Golf Club.

Average Sale Price Down 12.83% in Pradera from it’s high in 2008. See data below.

After writing an article detailing home sale trends over the past 4 years in Stonegate, another Parker, Colorado community, I was asked to produce the same stats for Pradera Golf Club.

Over the past 12 months I have witnessed a new found demand for high end luxury homes in Douglas County including the custom home communities of Pradera and The Timbers. We all noticed the demand slow down for about a 12 month period in late 2008 and early 2009 simply because banks would not lend money to high-end luxury home buyers.

Well the lenders are back and so is the pent up demand from custom home buyers. Currently a majority of the home sellers and buyers I’m working with are in what I consider to be the high-end market. Steve’s definition of high-end = anyone buying or selling above $750,000.

What do you get when you list your home for sale with Steven Beam? See it here.

Here are the numbers for Home Sales in Pradera that have a sold closing price ABOVE $750,000 since 2007.

Total Sales by Year: (2008 was hot then the breaks were applied by the banks.)

2007 = 12

2008 = 19

2009 = 11

2010 = 9

Average Total Days on Market: (Like I said 2008 was HOT for custom home buyers)

2007 = 225

2008 =125

2009 = 216

2010 =207

Average NET Sold Price: (12.83% decrease in Value from high to low year.)

2007 = $1,085,417

2008 = $1,104,927

2009 = $975,631

2010 = $963,200

Remember I am only showing stats from homes that sold and closed at or above the $750,000 price point in Pradera Golf Club.

Total Volume of NET Sales By Year in Pradera Golf Club:

2007 = $13,025,000

2008 = $20,993,608

2009 = $10,731,943

2010 = $8,668,800

Average NET $ or Price per sqft Sold: (This is the sqft on the main level and upper level. It does not include the basement.)

2007 = $286

2008 = $314

2009 = $253

2010 = $276

Average Price per sqft Finished. (All finished sqft included.)

2007 = $224

2008 = $207

2009 = $172

2010 = $162


Parker Colorado has Four Blackeyes

Home for Sale in Stonegate

Be a Voyeur in Your Neighborhood

Contact-Us Search-Homes What-is-my-Home-Worth

Tags: , , , , , , ,

posted by Steven Beam // 4 Comments »

Newlin Meadows Real Estate Market Report Oct 2010

Nov 29th 10

filed under: Newlin Meadows, Real Estate Stats

Newlin Meadows Real Estate Market Report

Newlin Meadows Real Estate Market Report

Real Estate Market Report for Newlin Meadows Neighborhood in Parker Colorado.

For this market report I will show you information on home sales in Newlin Meadows that were SOLD and CLOSED from January 1, 2010 to October 31, 2010.

Here is a link to the 2009 Year-end Market Report for Newlin Meadows so you can compare the data. So far for 2010 it has been a much slower year for home sales in this Parker neighborhood.

See a spreadsheet here with full data on the homes sold in Newlin Meadows.

Homes Sold = 7

Average Days on Market = 83

Average Original Asking Price = $400,442

Lowest Original Asking Price = $329,900

Highest Original Asking Price = $465,000

Average NET Sales Price = $374,985

Total NET SOLD Volume of Newlin Meadows Sales from Jan to Oct 31st 2010. = $2,624,900

For more information or to have a market analysis of your current property please fill out the form below.

How May I Help You?
  1. (required)
  2. (required)
  3. (required)
  4. (required)
 

Tags: , , , ,

posted by Steven Beam // Please leave a comment.

Idyllwilde in Parker Colorado Real Estate Market Report

Jul 8th 10

filed under: Real Estate Answers, Real Estate Stats

This is the real estate & homes sold market report for Idyllwilde and Reata North in Parker Colorado. These are homes that sold and closed from January 1, 2010 to June 1, 2010.

This homes sold report does not inclde FSBOs so there could possibly be other sales.

Idyllwilde is a neighborhood in Parker Colorado that was developed and built by Village Homes. Twice winning the neighborhood of the year for the Denver Metro area. Amenities such as a great trails, parks and a massive pool and Clubhouse make Idyllwilde a definite MUST SEE for any Parker Colorado home buyer.

Home prices in Idyllwilde range from the MID $200’s to well over $500,000.

“It’s been a GREAT year so far for Idyllwilde. In all of 2009 there were 16 homes sold and closed. We are almost at 2009 levels for only six months in 2010 with 15 sold and closed homes in Idyllwilde.

Market Report for Idyllwilde

  • Total Homes sold in Idyllwilde from Jan 1, 2010 to June 1, 2010 = 15
  • Average Total Days on Market = 104
  • Average NET Sales Price = $346,643 (NET is after any seller concessions)
  • Average Original Asking Price = $376,913 (asking price before any price reductions)
  • Average Asking Price at Time of Sale = $347,591
  • Average Price Per SQFT = $143
  • Lowest NET Sales Price = $265,000
  • Highest NET Sales Price = $514,500
  • Highest Original Asking Price = $614,900
  • NET Volume Sold = $5,199,650

Canterberry Crossing Real Estate Homes Sold Market Report

Idyllwilde Home Currently For Sale – VIDEO

Article about a new listing in Idyllwilde by Village Homes

Fun things to do in and around Parker Colorado

Contact-Us Search-Homes What-is-my-Home-Worth

Tags: , , , , , ,

posted by Steven Beam // Please leave a comment.

Canterberry Crossing and Villages of Parker Market Report

Jul 1st 10

filed under: Just Cool Photos

No matter whether you love or hate math we all love to look at the REAL numbers for homes sold in our particular neighborhood. Below you will see a serious look at the numbers for Canterberry Crossing and The Villages of Parker in this real estate market report. All the homes sold in Canterberry or The Villages of Parker will be represented here UNLESS it was a FSBO. For Sale by Owner or an outside non-MLS builder sale. There are a very, very few of these in Canterberry or The Villages of Parker since the neighborhoods are both nearly sold out.

See every home CURRENTLY for sale in Canterberry Crossing and The Villages of Parker.

Full Spreadsheet Here!

Steven Beam is a Parker Colorado CRS Real Estate Broker.

This will be a comparison between the sales from January 1, 2010 to June 1, 2010 and ALL of 2009 sales .

  • Homes Sold in 2009 = 117 versus 50 for the first half of 2010.
  • Average Days on Market in 2009 = 100 versus 79 DOM in the first half of 2010.
  • Average Original Asking Price in 2009 = $349,208 versus $330,039 in 2010 so far. Original asking price means BEFORE any price reductions.
  • Average Asking Price at Time of Sale for 2009 = $ 328,459 versus $311,716 for the first half of 2010.
  • Average NET Sold Price for 2009 = $325,014 vs $312,772 for 2010. NET sales price is what the seller received after any seller concessions to the buyer.
  • Average $ Per Sqft Sold in 2009 = $136 vs $134 in 2010. Price per sqft is figured on the sqft above ground not the basement.
  • Average NET Sales Price vs Average Original Asking Price 2009 = 93.07 vs 94.77 – Tells us sellers are now pricing homes more in line with the market. A little more anyway.
  • Lowest NET Sales Price in 2009 = $180,000 vs $204,900 in 2010.
  • Highest NET Sales Price in 2009 = $625,000 vs $515,000 so far in 2010.
  • Total NET Volume Sold in 2009 = $38,026,693 vs $15,638,583 for the first half of 2010.

Basically even though the market seems to be moving right along in 2010 (especially before April 30th when the tax credit was in play) this shows us that so far Canterberry and The Villages of Parker are a little behind 2009 at least for now. We will see what happens over the next 6 months.

Contact-Us Search-Homes What-is-my-Home-Worth

Tags: , , , , , , , ,

posted by Steven Beam // Please leave a comment.

Pradera Golf Club Real Estate Market Report

Jun 8th 10

filed under: Pradera, Real Estate Answers, Real Estate Stats

Custom Home for Sale in Parker Colorado

Custom Home for Sale in Parker Colorado

Pradera Real Estate in (Parker Colorado) Real Estate Market Report

January 1, 2010 to June 1, 2010

This is the homes SOLD report for Pradera Golf Course Community. All homes sold and closed should be shown here except for possibly FSBO’s and may a builder sale.

See every home for sale in Pradera Here.

  • Total homes sold in Pradera Golf Club = 10
  • Highest Priced home sold = $1,095,000 ( Steve Beam sold this one!)
  • Lowest priced home sold = $439,900
  • Average NET Sales Price = $627,745 (sale price minus any sales concessions from the seller)
  • Average Original Asking Price = $688,857
  • Average Asking Price at time of offer = $658,842
  • Average Days on Market = 129
  • Average Price per SQFT = $161
  • Average Price Per SQFT FINISHED AREA = $127
  • Total Sale Volume = $6,277,453

Video helps Sell Million Dollar Home in Pradera

2009 Yearend Sales Report for Pradera Golf Club

Stonegate Neighborhood Homes Sold Report

Contact-Us Search-Homes What-is-my-Home-Worth

Tags: , , , , , ,

posted by Steven Beam // Please leave a comment.

Stonegate Neighborhood Homes Sold Report 1st Half 2010

Jun 2nd 10

filed under: Real Estate Answers, Real Estate Stats, Stonegate

Quickly this is a report on all the homes that have sold and closed in Stonegate in Parker Colorado since January 1, 2010. This does not include homes sold as for sale by owner.

Ideally I would post this report every quarter but honestly with two small kids and a busy real estate career blogging all the neighborhood reports quarterly is sometimes a touch overwhelming.

Every Home for Sale in Stonegate Here NOW

See the full spreadsheet here for the homes sold in Stonegate.

  • Total Homes Sold in Stonegate Jan 1 to May 25th, 2010 = 43
  • Average Original Asking Price (before price reductions) = $317,503
  • Average Listing Price at time of sale = $309,049
  • Average Sold Price $303,111
  • Average NET sold price (after seller contributions) $299,398
  • Highest sold price $460,000
  • Lowest Sold Price $163,000
  • Sold Volume $13,033,760

We are all waiting to see the impact from the Home Buyer Tax Credit expiring. If the market continues to be this active Stonegate Home Sales should see another good year. The location and amenities of this neighborhood make it a highly desirable area to live. Check out the new pool area and the massive open spaces and playgrounds.

Contact-Us Search-Homes What-is-my-Home-Worth

Tags: , , , , , ,

posted by Steven Beam // 1 Comment »

Parker Colorado Real Estate Market Update

Apr 20th 10

filed under: Highlands Ranch Homes, Homes for Sale, Lone Tree Colorado Homes, Real Estate Answers, Real Estate Stats, Stonegate, The Timbers

Parker Colorado Real Estate Update

Parker Colorado Real Estate Update

The real estate market in Parker Colorado and South Metro Denver is on fire. The current market activity reminds me of the late 1990’s and the early 2000’s.

My listings are going under contract at record speed and the inventory for buyers is shrinking compared to 2 years ago. I have also noticed that the homes that are for sale have been well maintained as the sellers have really worded hard to get them into show quality condition. I’m noticing updates on homes that were not previously there such as granite, tile and new carpet and paint.

“I see many homes back on the market now that were listed last year with unrealistic asking prices and definitely not in show condition. These homes have been spruced up and re-listed for sale with new lower prices.”

I seriously need more homes/listings for the current demand. Call so we can sell your property. Steven Beam 303-941-4663.

All indications point to a great year in real estate sales. Enjoy 2010!

Sincerely,

Steven Beam, Parker Colorado Realtor.

Contact-Us Search-Homes What-is-my-Home-Worth

Tags: , , , , , , ,

posted by Steven Beam // 1 Comment »

Horse Creek Neighborhood 2009 Yearend Real Estate Market Report

Mar 9th 10

filed under: Horse Creek, Real Estate Stats

Here it is. The 2009 real estate market report for the Horse Creek subdivision in Parker Colorado. This report shows all the homes sold for 2009 in Horse Creek.

Special thanks to Dan K.  for requesting this report as I have been slow to get them all completed. Please don’t hesitate to request specific information or stats. I love putting them together.

Please make sure to see the FULL spreadsheet here of the 2009 sales and numbers. Here is the spreadsheet for 2008 homes sold in Horse Creek in Parker , Colorado.

Two very different years for Horse Creek. 2009 versus 2008 the total sales numbers are far below what was sold in 2008 and to be honest 2008 for me was no where near as good as 2009. I know the election and the havoc caused by that and the massive stock market drop had a lot to do with the 2009 slow down. No worries. Douglas County is strong, wealthy and highly educated. They cannot keep us down for long and I can already see a massive influx of new relocation buyers and sellers for the Douglas County real estate market in 2010. So hang on and get ready for a wild ride. I see a great year in the making.

Parker is about to see another round of foreclosures and yes most will be in the lower price ranges but I am also seeing quite a few on the upper end as well. I guess all the people that held out over the last two years have run out of cash or the energy to keep up the payments.

See Every Home for Sale in Horse Creek Here!

Homes by price range in Parker

PREDICTIONS-Parker Colorado Top 10 List for 2010.

More on Horse Creek

Numbers for Horse Creek for 2009

  • Number of homes sold = 27 for 2009 versus 51 for 2008
  • Highest Priced Home Sold: $450,000 for 2009 versus $435,000 for 2008
  • Lowest Priced home Sold: $208,550
  • Median Price Sold: $364,000
  • Median Price List: $390,000
  • Median Original List Price: $389,900 (this is before any price reductions) Yes I see that it is lower than the Median Original List Price above. I’m using the numbers as I see them I cannot explain this other than someone must have raised their asking price at some point.

Volume

  • 2009 NET Volume Sold = $9,218,713
  • 2008 NET Volume Sold = $17,052,205

Averages

  • Average Days on Market = 98 for 2009 versus 80 for 2008
  • Average Difference between Original Listing Price and NET Sales Price = 92.20%
  • Average NET Sold Price = $341,434
  • Average Price Per SQFT = $133
  • Average Original Listing Price: = $370,304
  • Average Square Feet: = 2603 (not counting basement)
  • Average Concession = $5,499 This is an amount given to the buyer from the seller for closing costs usually. It is subtracted from the selling price to get the NET selling price.

If you want more call me 303-941-4663 or send me an email. Steven Beam is  Parker, Colorado Realtor living and working in this area.

Contact-Us Search-Homes What-is-my-Home-Worth

Tags: , , , , , , ,

posted by Steven Beam // 1 Comment »

Idyllwilde in Parker Colorado – Real Estate Market Report 2009 Yearend

Jan 30th 10

filed under: Real Estate Answers, Real Estate Stats

Idyllwilde 2009 Market report

Idyllwilde 2009 Market report

Idyllwilde located in Parker Colorado had a tough time as a brand new neighborhood when the real estate market took a screeching halt a few years ago. In it’s first two years of existence it won the “Neighborhood of the Year” award and was the talk of the town. Now that the builder Village Homes has slowed down production of new homes it has finally allowed the re-sale homes to catch up and prosper.

“While 2009 was not the best of years for the real estate market we did see some really nice sales in the neighborhood.”

See every home currently for sale in Idyllwilde HERE.

Please make sure to see the FULL spreadsheet here of the sales and numbers. Coming Soon!

Numbers for Idyllwilde for 2009

  • Number of homes sold = 8 for 2009 versus 18 for 2008
  • Highest Priced Home Sold: $492,000 for 2009 versus $877,925 for 2008
  • Lowest Priced home Sold: $311,800 for 2009 versus $289,600 for 2008
  • Median Price Sold: $370,250
  • Median Price List: $399,450
  • Median Original List Price: $429,142 (this is before any price reductions)

Volume

  • 2009 NET Volume Sold = $3,015,300
  • 2008 NET Volume Sold = $7,829,255

Averages

  • Average Days on Market = 221 for 2009 versus 249 for 2008
  • Average Difference between Original Listing Price and NET Sales Price = 83.04%
  • Average NET Sold Price = $376,913
  • Average Price Per SQFT = $148
  • Average Original Listing Price: = $453,892

If you want more call me 303-941-4663 or send me an email.

Contact-Us Search-Homes What-is-my-Home-Worth

Tags: , , , , , , , ,

posted by Steven Beam // 1 Comment »